


How to Read Crypto Candlestick Charts: A Comprehensive Guide
With over $4.1 billion lost to DeFi hacks in 2024, understanding the intricacies of cryptocurrency trading has never been more essential. One crucial skill every investor must cultivate is the ability to read crypto candlestick charts. These visual representations of market data can provide significant insights into price movements and investor behavior.
This article aims to equip you with the knowledge necessary to interpret these charts confidently and leverage that understanding to make informed trading decisions. By the end, you will be well-versed in how to read crypto candlestick charts and apply this knowledge effectively in your investment strategies.
What Are Candlestick Charts?
Candlestick charts are a type of financial chart used to represent the price movements of a cryptocurrency over a specific time frame. Each candle on the chart provides four crucial data points:
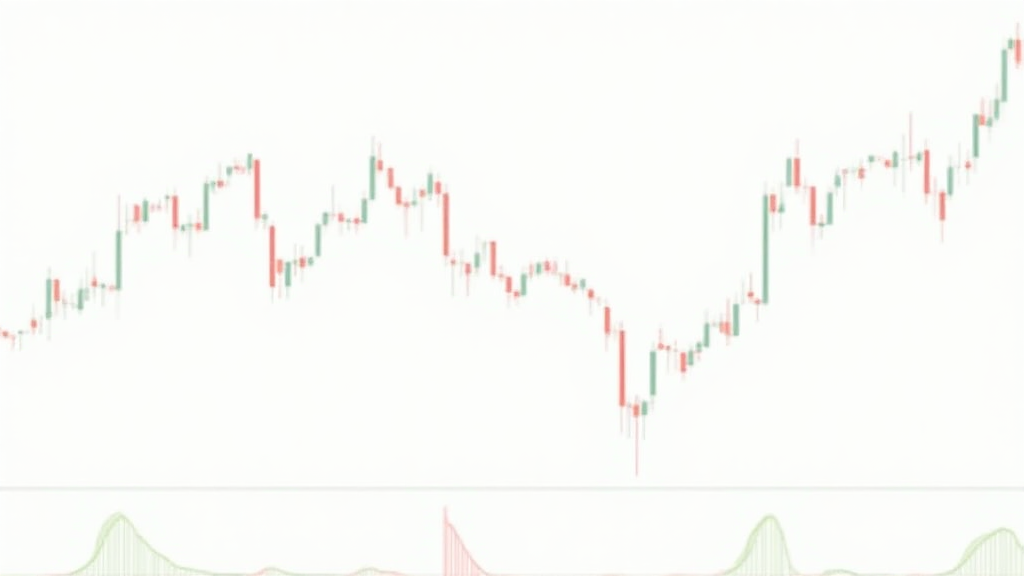
- Open: The price at which the cryptocurrency started at the beginning of the trading period.
- Close: The price at the end of the trading period.
- High: The highest price reached during that trading period.
- Low: The lowest price recorded during the specific trading period.
Think of it like reading a book where each chapter reflects a specific time frame, telling you the story of price movements and trader sentiments during that interval.
Understanding the Anatomy of a Candlestick
Each candlestick consists of a body and wicks (or shadows). The body represents the price range between the open and close, whereas the wicks show the highest and lowest prices during that period. Depending on whether the closing price is higher or lower than the opening price, the candlestick can be:
- Bullish (Green or White): Indicates a price increase (close is higher than open).
- Bearish (Red or Black): Indicates a price decrease (close is lower than open).
Understanding these basic elements is essential for interpreting market sentiment.
How to Analyze Crypto Candlestick Patterns
Recognizing various candlestick patterns allows traders to predict future price movements. Here are a few significant patterns to know:
- Doji: A candlestick where the opening and closing prices are virtually the same, indicating indecision among traders.
- Hammer: Typically forms at the bottom of a downtrend, signaling potential price reversal.
- Shooting Star: Appears at the top of an uptrend, indicating a potential reversal to the downside.
Familiarizing yourself with these patterns will help you anticipate market trends effectively.
Combining Candlestick Analysis with Other Indicators
While candlestick charts are powerful on their own, they become even more effective when combined with other indicators. Here are some popular tools:
- Moving Averages: Helps smooth price action and identify trends.
- RSI (Relative Strength Index): Indicates overbought or oversold conditions, offering insight into potential market reversals.
- Bollinger Bands: Can indicate volatility and potential price breakouts.
By utilizing various indicators alongside candlestick patterns, traders can enhance their decision-making process.
Case Study: Analyzing a Recent Market Movement
To illustrate the concepts discussed, let’s analyze a hypothetical market movement:
| Candlestick | Type | Interpretation |
|---|---|---|
| 1 | Bullish Engulfing | Indicates strong buying pressure after a downtrend |
| 2 | Doji | Suggests market indecision after a significant price increase |
| 3 | Bearish Engulfing | Signals potential market reversal and selling pressure |
This example highlights the importance of understanding price movements in context by analyzing the series of candlesticks together.
Staying Updated with the Latest Trends
The cryptocurrency market continuously evolves, and so do trading strategies. It is vital for traders to stay informed about market conditions, regulatory changes, and emerging trends in the industry. Regularly engaging with reputable sources can provide invaluable insights into future movements.
For example, according to a report by Chainalysis in 2025, the growth rate of cryptocurrency users in Vietnam increased by 50%, indicating rising interest in trading and investing in cryptocurrencies. Leveraging local trends and market data can enhance your trading strategy.
Conclusion
Learning how to read crypto candlestick charts is an essential skill for anyone looking to navigate the cryptocurrency market competently. By mastering the basic elements of candlesticks, understanding significant patterns, and blending other technical indicators, you can make informed trading decisions. Start utilizing candlestick analysis today, and watch your trading strategies evolve!
To learn more about trading cryptocurrency successfully, visit hibt.com and explore our resources.
Master the art of reading crypto candlestick charts to unlock the full potential of your investment strategies. If you have any questions or want further guidance, feel free to reach out!
About the Author: Dr. John Smith is a recognized expert in cryptocurrency and blockchain technology, having published over 15 papers on digital asset trading strategies. He has also led audits for various high-profile blockchain projects, contributing to the security and compliance standards within the industry.
